Computer Graphics Laboratory ETH Zurich

ETH

Scientific Visualization (SS 06) - Exercises

Home | Course Notes | Exercises | Schedule
Exercises

Exercises

Assignments

21.04.2006 Reading Assignment (Topic: Isosurfaces)

05.05.2006 Reading Assignment (Topic: Volume Rendering)

19.05.2006 Practical Exercise (Topic: Vector Field Visualization)

02.06.2006 Reading Assignment (Topic: Flow Visualization)

16.06.2006 Practical Exercise (Topic: Vector Field Visualization)

30.06.2006 Reading Assignment (Topic: Vector Field Topology)


Interesting Links

  • VTK - the Visualization Toolkit  
  • LEA algorithm applied to daily wind forecasts
  • The full Hurricane Isabel dataset is described here, but please note the error in this description. The x,y,z axes are as described, but the data are given in a permuted order.

    If i the denotes the fastest and k the slowest varying parameter, then
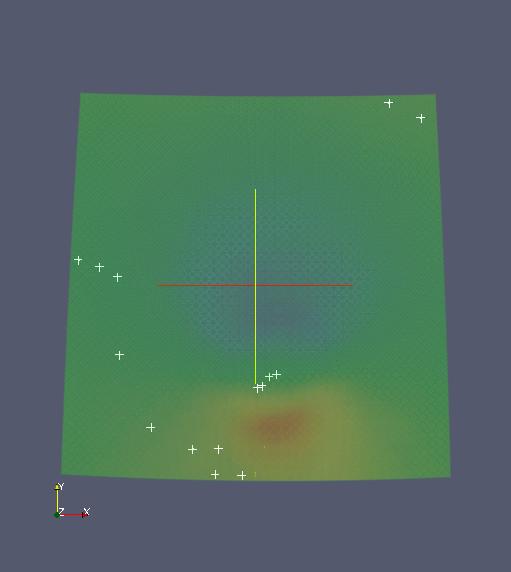
    • the i parameter runs from north to south (negative y direction)
    • the j parameter runs from west to east (x direction)
    • the k parameter runs from low to high altitude (z direction).